


On the morning of December 7, 2017, the San Juan County Sheriff’s Department responded to an active shooter incident at Aztec High School in Aztec, New Mexico. Shortly after 8 a.m., a 21-year-old male concealing a 9 mm semi-automatic pistol had entered the school. Two students were killed before a quick lockdown of the school prevented the murder of dozens more. After firing 82 shots over the course of approximately 10 minutes, the gunman, himself a former Aztec HS student, committed suicide.
More than 400 miles to the south, Crime Scene Investigator Clint Norris, of the New Mexico State Police in Las Cruces was deployed to the incident with his agency’s Leica Geosystems laser scanner, the fastest, most accurate and most reliable way to capture comprehensive documentation of the scene. Three additional Leica Geosystems laser scanners were brought in from around the state. Norris and three other investigators were responsible for scanning and other crime-scene-processing duties.
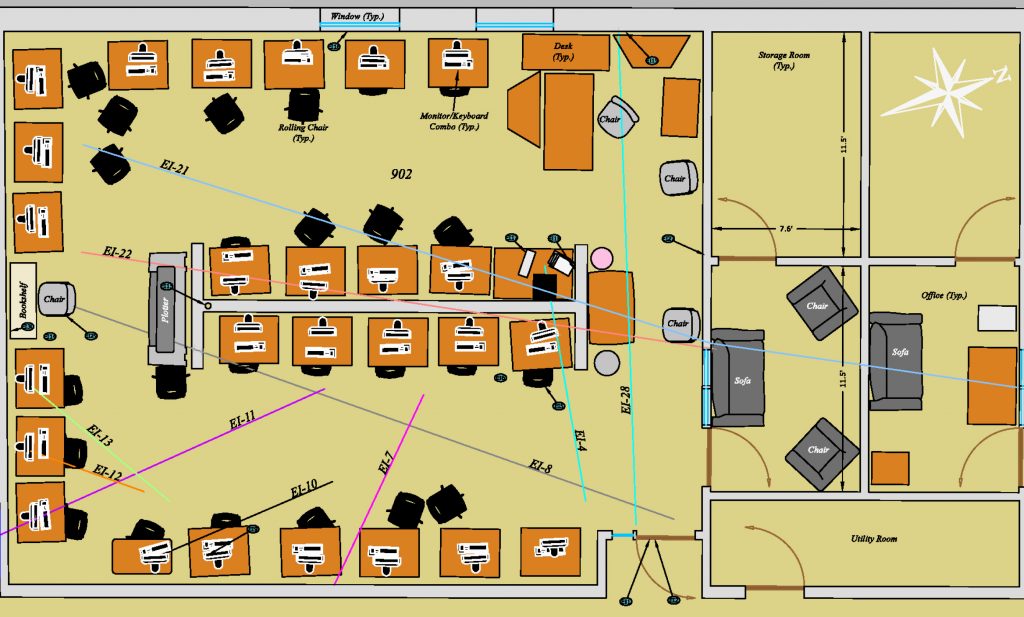
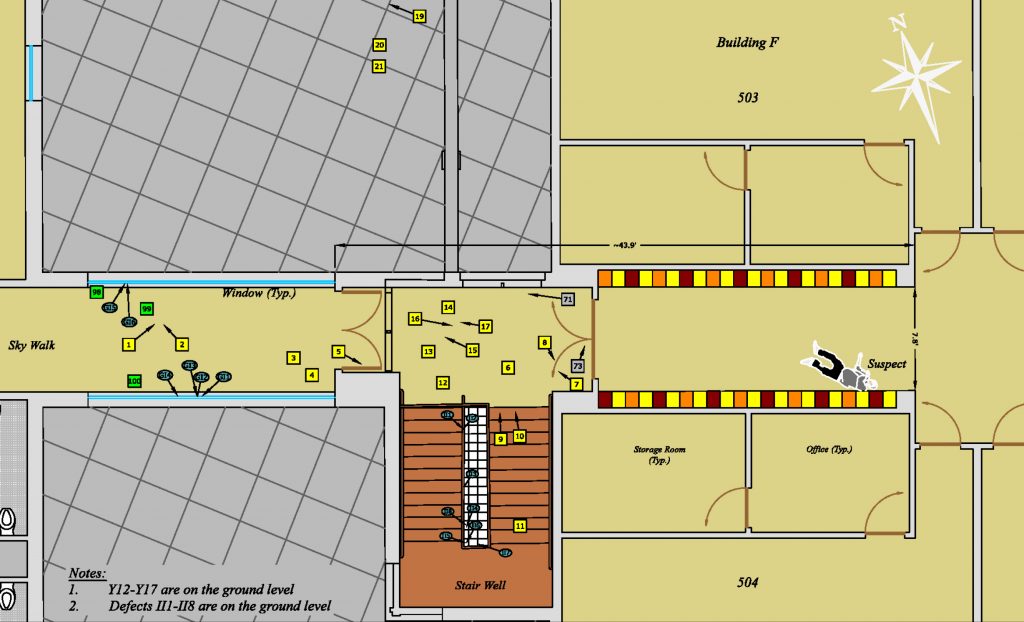
The scene comprised two double-story buildings connected by a skywalk. Norris and his team primarily scanned the areas that were directly part of the incident. “One was a classroom that had been shot up quite a bit. It was the only classroom that the shooter could actually gain access to,” Norris says. “We had the bathroom area where our two victims were located, some upper and lower level areas to cover how the shooter was able to get into the building and some of his paths going up and down stairs.”
They were also concerned with providing context to other aspects of the response while working through the scene. “We did external scans that incorporated the two buildings in question and a little bit beyond that to be able to deal with first responders on the scene and some of the parking lot areas,” he says. After over 30 hours on scene, Norris returned to Las Cruces with five separate projects totaling 83 scans as well as imagery.
Comprehensive Data Creates Diagramming Challenge
Back at the office, Norris registered the projects together into a single point cloud that comprised more than 1.5 billion points. It was Norris’s job to create diagrams that would best depict the scene and its contents. Even though the Aztec case would never go to criminal trial, the forensic mapping data would be valuable for post-incident analysis. “It was important to me to have the diagrams as clear, concise and accurate as possible,” he says.
His most obvious challenge was reducing 1.5 billion points of scan data to a series of informative diagrams. But it was also a challenge to strike a balance between time, effort and detail. “I tend to go a little bit overboard in my details in part because I enjoy the drawing process,” he says. “But I have to balance that with the constraints of time.”
Smart Strategy and CAD-Based Software Simplify the Diagramming Process
To create the diagrams, Norris used Map360, part of the Leica Geosystems Incident Mapping Suite (IMS). The desktop software’s easy-to-use interface, IntelliCAD engine and multisensor support enabled Norris to import, process, analyze, visualize and create clear, concise deliverables. “One of the many great things about Map360 is how easily you can interact with the point cloud,” he says. “It works seamlessly with Cyclone.” Leica’s Cyclone Object Exchange, or COE, application enabled Norris to import and export files directly between Cyclone and Map360 while maintaining links and information. “The ease of bringing in and working with the point cloud was tremendous,” he says.
To begin the diagramming process, Norris accessed the Cyclone database on his computer, navigated to the model space he wanted to bring in, and then used the point cloud as the basis for his drawing. “Viewing from the top down, I could see the outline of the walls and other elements within the scene very clearly and draw directly to that with a high degree of accuracy,” he says. He also appreciated the ability to snap to the end points of lines to achieve sharp, connected corners. “If I had to take measurements in Cyclone and then translate those measurements to an actual drawing in a diagram program, that would have taken a long time,” he says.
Norris routinely provides multiple diagrams for his reports. “In the program I used before,” he says, “to get 10 diagrams, I had to have 10 different drawing files and draw everything that I would ever use.” Map360’s layout tabs, customizable templates and view ports allowed Norris to draw once and adjust his view of the scene as needed. “With Map360, I can have 10 diagrams but just one drawing file,” he says.
Seamless Interaction with Point Cloud Streamlines the Evidence Marking Process
With 197 different evidence markers on scene and some evidence in inaccessible areas for the scanners (like ceilings), it was impossible to include every item in the diagrams. “But everything that was important or that we could with confidence be able to place in there, we did,” he says.
In times past, Norris would mark an item in Cyclone with a vertex, take measurements, and then draw the item in its location in the diagram program. Map360’s ability to import and export COE files has streamlined the process. “Now, I can mark all of these different evidence markers in Cyclone utilizing different colors and different layers to coincide with our green, red and white evidence markers. I was able to segregate those and work with small chunks at a time. So if I had 50 evidence markers in one location, I could export those vertices from Cyclone as a COE file and bring them into Map360 in the exact same place in relationship to the point cloud on its own layer,” Norris says. “I’m not having to measure each one in Map360. I just have to use a snapping tool, which recognizes that vertex and snaps in the center of it.”
To accurately diagram the bathroom where the victims were located, Norris needed to use a combination of the point cloud and photographic imagery. “The room was scanned early on in the investigation phase, and the evidence was marked a little bit later due to some of the constraints of trying to get bodies off the scene as soon as was possible and reasonable,” Norris explains. “I had photos showing where this evidence was located, but it wasn’t necessarily clear in the scan data.” Since the bathroom tiles created a 2-by-2-inch grid, Norris used it as a coordinate system to accurately mark where a particular item of evidence was seen in the photograph. “That speaks to the great accuracy of the point cloud—but also of the point cloud extension and how it renders in Map360— that I’m seeing these individual tile lines and can draw to that great degree of accuracy,” he says.
Extra Detail Provides a More Realistic Look for Viewers
Even though time constraints tend to prevent Norris from being as detailed as he would like, some details were non-negotiable. “I felt a higher level of detail was appropriate for the Aztec shooting because I wanted to show things where they were in relationship to other items and have it be as realistic and accurate as possible,” he says.
Norris could have used symbols from the Map360 library, but he preferred to draw almost everything manually, including the bodies of the victims. He also chose to draw the computers in the computer lab. Since they were identical, he outlined one monitor and one keyboard. “Then I just copied those and oriented them to their location in the point cloud data and gave it a much more realistic look,” he says. “The ability to do that was, to me, very important.”
Though it may not have been technically necessary, Norris also drew the expansion joints in the exterior concrete walks and pads. “If there was anything to help clarify the memory of a participant, to me, that’s important,” he says. For instance, he explains, if a first responder stumbled or tripped over a raised expansion joint, seeing those features on a diagram might help jog that memory. “It was important to me to be able to give the most options available to an interviewer or the interviewee for the clearest and most accurate recall,” Norris says. “So that was an element of my choice to be able to more detailed than maybe I had to.”
Work Products Support Post-Incident Training and Analysis
The scan data and Norris’s diagrams became part of a presentation given at a conference for school resource officers and later to the administrators, faculty, staff and school resource officers of Las Cruces High School. “They were used to explain what occurred and some of the things that were learned in terms of response and what happened after trying to get students to a safe location and reunite them with friends, family or guardians,” he says.
Advanced Software Aids Efficiency
Aztec High School shooting was Norris’s most complex scene to-date, and it was challenging to balance time and quality amid his other cases and duties. “I spent a lot of time—and we’re talking days and days—doing the diagrams for Aztec, and it was appropriate, but I did have to keep in mind that I needed to save as much time as I could,” he says. “And the advances in software tools like Cyclone and Map360 helped me strike that balance to the best of my ability.”
To learn more about solutions for digital scene documentation and mapping, contact us.